Oracle Transactional Business Intelligence is a powerful tool that allows users to generate reports and dashboards directly from transactional data in Oracle Cloud applications. If you’re looking to visualize your data effectively and make informed decisions, creating OTBI Dashboard in Oracle Fusion ERP is a game-changer.
Dashboards provide a consolidated view of key metrics and performance indicators, enabling users to monitor and analyze business processes in real-time. With dashboards, you can quickly spot trends, identify issues, and make data-driven decisions without sifting through heaps of raw data. Think of it as your command center, where you can see all critical data points at a glance.
Create Dashboard in OTBI
Creation of OTBI dashboard requires majorly 3 components, an analysis report, a dashboard prompt on which user make parameters selection and a dashboard to display both analysis report and prompt.
Create Analysis
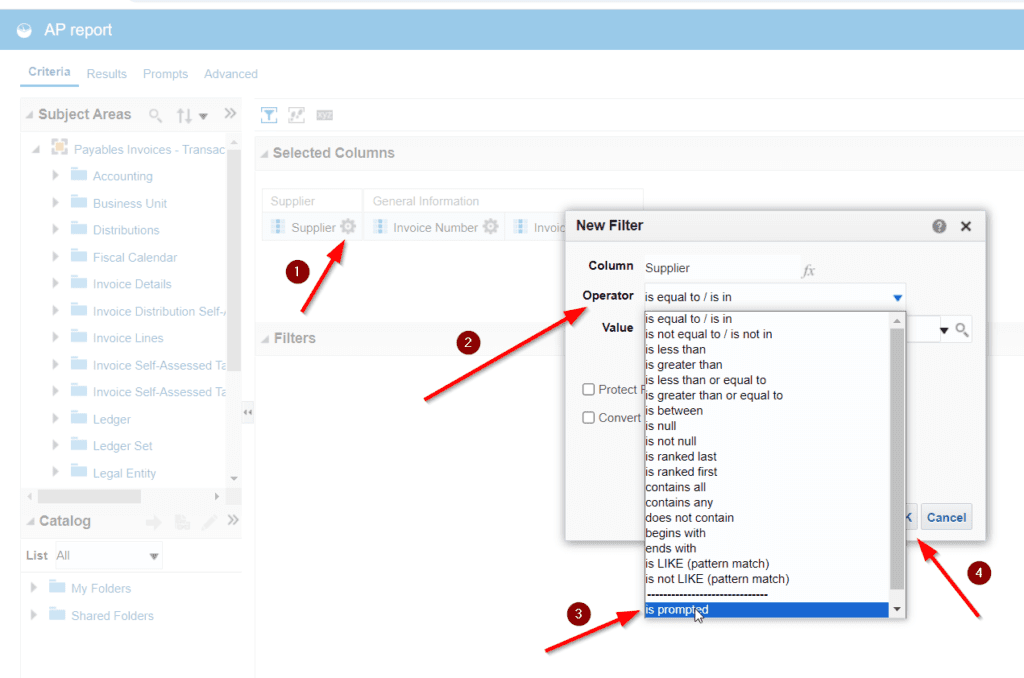
We will use same analysis developed earlier and set the filter on supplier field to prompt as follows. Click ok and save the analysis.

Create Dashboard Prompt
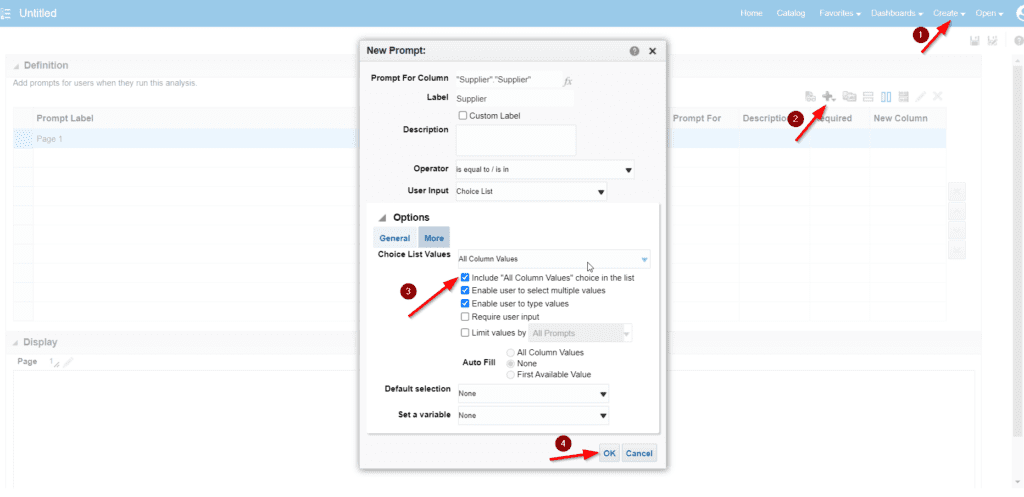
In step 1, click Create and choose dashboard prompt followed by subject area which is Payables Invoices – Transactions Real Time. Then choose column prompt in step 2, check “include All Column Values” in step 3 and click ok and save the prompt in step 4.

Create Dashboard
Under Step 1, click create and choose Dashboard and give it a name and choose location to save the dashboard. Then from catalog section, drag prompt to header section and analysis report to body section. You can also customize the dashboard layout by adjusting the size and position of the reports and graphs. Use themes and styles to enhance the visual appeal.

Finally click save and run the dashboard. Select one or multiple suppliers and click apply button to see invoices related to selected suppliers on dashboard.

Conclusion
Creating dashboards in OTBI is a powerful way to visualize and analyze your business data. By following these steps and best practices, you can design effective dashboards that help you make informed decisions.